The home screen
The home screen is the first thing you see when you log in to the ERP. It brings together in cards what matters for your work: open work, what you have pending, a “how-to” and a suggestion from the program itself. By default it shows no amounts: financial figures are chosen with a panel set. Each workspace comes with its own default layout, and each person can change theirs. Here is what each panel is, what each card shows and why it changes when you change workspace.
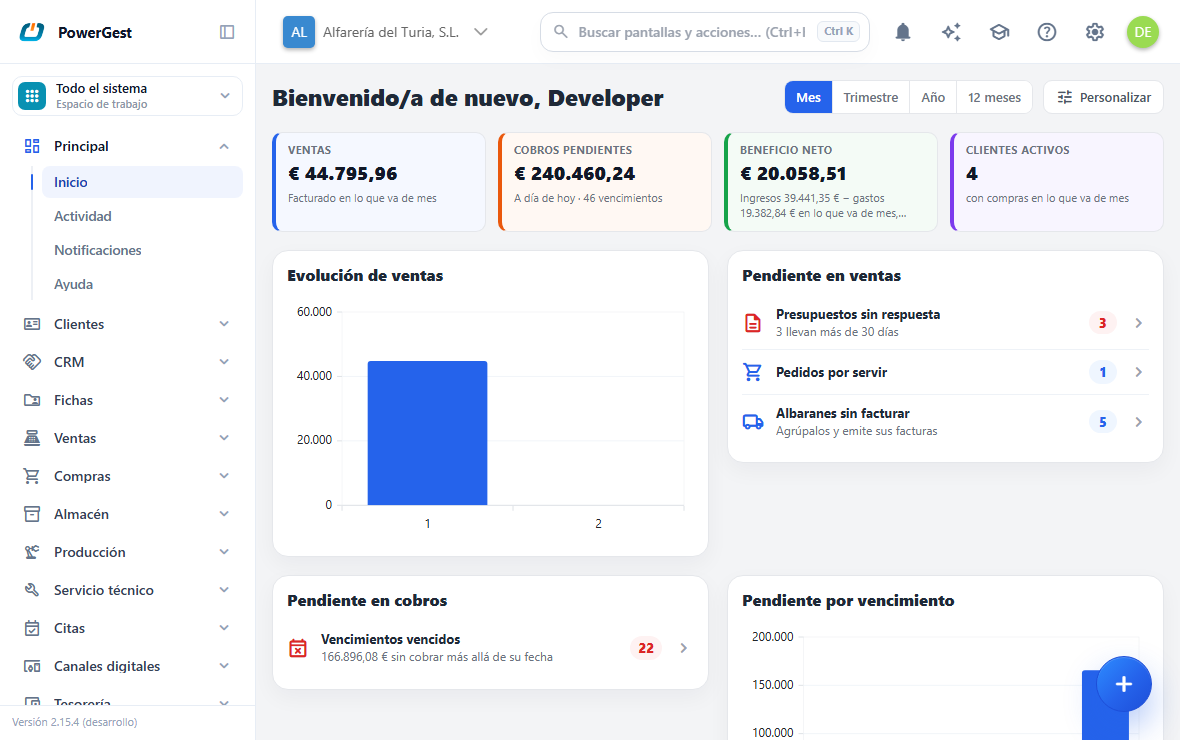
What is on the home screen?
What matters in the current company, spread over three panels. It is the first thing you see when you log in to the ERP, and each workspace has its own.
At the top is the top summary panel: individual figures, with their title above, to see them at a glance.
Below is the main panel: the grid of large cards. Each card takes up a quarter of a row, half a row or the whole row. By default it alternates: a list of pending items next to a chart, and a “how it’s done” next to a suggestion.
To its right is the right panel (reports and tables): a narrow rail with tables, lists and pending items. On narrow screens it drops below the main panel.
No panel is required. If you have nothing in one, that panel isn’t drawn and the others take up the full width.
Under the greeting, a line says which workspace’s home screen you are looking at (‘Your workspace home Sales’). With no workspace chosen it says nothing: it is the home screen of Whole system.
What does each workspace come with by default?
The default layout isn’t the same for everyone: each workspace comes with its own, short and designed for that work. None of them shows amounts. Financial figures are chosen: with a panel set such as Management, or by adding them yourself from the tools panel of Customise.
| Workspace | Top panel | Main panel | Right panel |
|---|---|---|---|
| Whole system | Open quotes · Orders to fulfil · Delivery notes to invoice · Active customers | Pending in sales · Documents in the period · How-to · Suggestion | My tasks |
| Sales | Open quotes · Orders to fulfil · Delivery notes to invoice · Active customers | Pending in sales · Documents in the period · How-to: sales · Suggestion | My tasks |
| POS and Touch POS | Today’s tickets · Active customers | Documents in the period · How-to: sales · Suggestion | My tasks |
| Diary | Active customers | Documents in the period · How-to · Suggestion | My tasks |
| CRM | Active customers · Open quotes | Pending in CRM · Documents in the period · How-to: CRM · Suggestion | My tasks |
| Accounting | Delivery notes to invoice · Active customers | Pending in accounting · Documents in the period · How-to: accounting · Suggestion | My tasks |
A workspace you created by duplicating another starts with the original’s layout. One created from scratch starts with that of Whole system.
Why does my home screen change when I change workspace?
Because each workspace has its own home screen, and on purpose: the desk of someone who sells isn’t the desk of someone who keeps the accounts. When you choose another workspace in the top row of the side menu, the home screen rearranges itself instantly, without reloading.
What you see in each workspace is its default layout, or the one you have saved for that workspace. Customising the Sales home screen doesn’t touch the Accounting one or the Whole system one. How to do it and how to go back is in Customise my home screen.
If you are on the home screen and change workspace, you stay on it: Home exists in every workspace in the product.
Which cards can I have and what does each one mean?
The home screen offers sixteen cards. Each one looks at one part of the business and all of them use the current company. The figures and charts cover the period chosen at the top (Month, Quarter, Year or 12 months): see Choose the period of the figures.
Metrics (a figure)
| Card | What it measures |
|---|---|
| Sales | What was invoiced in the chosen period. It adds up sales invoices and subtracts credit notes. It only counts what is issued: draft documents aren’t included. Below, it says which span it covers. |
| Outstanding receipts | What customers owe you as of today: the live open items, with the number of instalments below. It is the only figure that doesn’t change with the period. If any instalment has no customer assigned, it says so right there (‘2 without a customer, not counted here’) because that figure can’t include them. |
| Net profit | What comes in minus what goes out in the chosen period. By default it comes from the accounts (income minus expenses from the journal entries), and from the invoices if your company doesn’t keep its accounts in the program. Below the figure it says what it is made up of. Where it comes from is chosen in Customise. |
| Active customers | How many different customers have any sales document in the chosen period, compared with the same span of the previous period. |
Charts
| Card | What it shows |
|---|---|
| Sales trend | What was invoiced in the period, in columns: one day per column with Month, one week with Quarter and one month with Year or 12 months. The columns add up to the same as Sales. |
| Purchases vs. sales | The same columns, with what was bought next to what was sold. It compares invoices with invoices: orders and delivery notes don’t count. |
| Outstanding by due date | Today’s open items split by age: Not yet due, 1–30 days, 31–60 days, 61–90 days and 90+ days. |
| Sales by family | How the period’s sales are split between item families, as a doughnut. |
| Cash flow | How much has come into the bank minus how much has gone out since the first day of the period. It is the flow, not the balance: the line starts at zero. |
Tables
| Card | What it lists |
|---|---|
| Top customers | The five customers with the most invoiced in the period, with the amount invoiced, the number of operations and what they still owe. |
| Outstanding invoices | The eight issued invoices with a receipt still open, sorted by the nearest instalment. The amount is what is still to be collected, not the invoice total. |
| Latest activity | The last ten issued sales documents, from newest to oldest. |
Pending (each row takes you to the screen where it is dealt with)
| Card | What it lists |
|---|---|
| Pending in sales | Your open work: quotes without a reply (with a warning for those more than 30 days old), orders to deliver, delivery notes not invoiced and invoices left as drafts. It only counts what is issued and not yet used; what has already been invoiced or delivered isn’t pending anything. |
| Pending in receipts | Receipt instalments already overdue, with their total, and those due in the next seven days. It comes from the same open items as Outstanding receipts. |
The rows of these cards are highlighted with a warning when something is urgent: a quote that has had no reply for more than a month, a draft invoice, an instalment past its date.
Suggestion: a recommendation from the program itself, which changes every day. See below.
What period are the figures for?
The one you have chosen at the top: Month, Quarter, Year or the last twelve months. It rules the whole screen, so changing it recalculates the figures and the charts at the same time.
The only one that ignores it is the outstanding receipts one: that is what you are owed today, whatever period it comes from.
What is the ‘Suggestion’ card and why does it change?
It is the program talking about itself: a feature you already have and perhaps don’t use (the AI assistant, recurring invoicing, direct debit batches, bank reconciliation…) or a module your installation hasn’t subscribed to and that might interest you. Each suggestion has a link to the screen it talks about, or to the one for subscribing if it is something missing.
It changes every day, so in fifteen days of trial you see fifteen different ones. Everyone in the same company sees the same one on the same day. It doesn’t show any figure from your company and so it doesn’t require any permission.
It only suggests what is relevant, and that means three things: what you already have isn’t advertised, no usage tips are given for what you don’t have, and what doesn’t fit your business isn’t offered to you. This last part comes from what you answered in the setup: if you said you don’t sell through an online store, it doesn’t suggest connecting one; if you only invoice by document, it doesn’t talk to you about the POS. What you didn’t get round to answering doesn’t count: a skipped question doesn’t take anything away, because skipping it isn’t saying no. If you don’t want it on your home screen, you remove it like any other card from Customise.
Can I ask the AI Assistant from the home screen?
Yes. In the right-hand panel, above what you have pending, there is the AI Assistant card: an animated sphere and a box to type in. Type your question and press Enter or the arrow: the assistant’s chat opens with the question already sent, and the answer carries on there, as if you had typed it in the chat itself.
Clicking the sphere or the expand button in the corner opens the chat without asking anything.
The card isn’t chosen in Customise: it doesn’t show your company’s data, it is the way into the chat, and it is always there when there is a right-hand panel.
Why doesn’t ‘Cash flow’ match my bank balance?
Cash flow isn’t the bank balance, and that is why it is called flow. The line starts at zero on the first day of the chosen period and keeps adding what comes in and subtracting what goes out.
It answers ‘am I generating or burning cash?’. If the line goes up, more has come in than gone out in that period. If it goes down, the opposite.
The real balance of your account is checked on the banks screen. The home screen doesn’t show it because the ERP stores the movements, not a snapshot of the balance on each date.
Why does ‘Net profit’ come out negative if the business is doing well?
Almost always because it looks at very few days. With the period on Month, on the 5th the figure only counts from the 1st to the 5th: if the rent bills come in on the 1st and up to the 5th you have only sold a little, the result for those five days is negative. It is correct for those days and says nothing about the month or the year.
Below the figure you have what it is made up of (‘Income 218,40 € − expenses 800,00 € so far this month’), so that you can see at a glance where it comes from.
If you prefer a figure that doesn’t jump about at the start of the month, click Year at the top: it counts from 1 January to today, and the charts and the other figures change with it too. If that is what you always want to see, in Customise → How the figures are calculated choose Year as the period on opening.
Where does ‘Net profit’ come from?
You choose it in Customise → How the figures are calculated, between three ways of getting the figure, and what you choose doesn’t change it for anyone else.
| Where it comes from | What it counts |
|---|---|
| Automatic (default) | The accounts if your company keeps them in the program; if there is no income or expense journal entry so far this financial year, the invoices. |
| Accounting | Income minus expenses from the journal entries (accounts 7 and 6). It includes expenses that aren’t purchases —payroll, rent, utilities— and leaves out the year-end closing entry. |
| Invoices | Sales invoices minus purchase invoices, excluding VAT, with credit notes subtracting. It only counts what is issued. |
The span of time isn’t chosen here: it is the period at the top, the same as for the other figures and charts.
Why doesn’t ‘Net profit’ match ‘Sales’?
They measure different things. Sales is what you invoiced your customers, VAT included. Net profit is what comes in minus what goes out, excluding VAT, and if it comes from the accounts it only counts what already has a journal entry: if your accounting is behind your invoicing, profit will be behind by the same amount.
How often are the figures updated?
The figures are updated every few minutes. The home screen doesn’t recalculate the whole business every time someone logs in: it keeps the result for a while and shares it among all the users of the current company.
In practice this means that an invoice you have just issued can take up to five minutes to appear in the figures. That is normal and there is nothing to fix.
If you need the figure instantly, look at the module’s screen: the invoice list, the receipts open items or the accounting journal always show the exact moment.
The delay is what lets the screen open quickly even when twenty people log in at once first thing in the morning.
Why does my colleague see cards I don’t have?
Each person only sees the cards for the areas their role reaches. A card shows business data, so it requires the same permission as the screen that data comes from.
Outstanding receipts, Outstanding by due date and Pending in receipts require access to receipts. Net profit requires access to accounting. Sales and Pending in sales require access to sales.
Some cards combine two areas and require both. Purchases vs. sales needs access to purchases and to sales: with only one of the two it doesn’t appear.
Suggestion doesn’t require anything: it doesn’t show your company’s data.
If you are missing a card you need, ask whoever manages the roles for the permission. As soon as you have it, the card appears by itself, without touching anything else.
Can I change which cards I see and how they are arranged?
Yes. The Customise button in the header opens a screen where you choose which cards you want, in what order, at what width and in which panel. What you build is the home screen of the workspace you are in.
The changes are yours alone: nobody else sees them, not even someone who shares your role.
How to do it is in Customise my home screen.
And if my home screen comes up empty?
It can happen for two reasons: your profile doesn’t reach any metric yet, or all of them were removed when customising. The screen itself offers you the ways out:
- Restore the default indicators goes back to the default layout of the workspace you are in (that is what solves the second case, and it doesn’t clear your period on opening).
- Customise my home opens the customisation screen.
- And some shortcuts to start working in the meantime: the company setup, your first invoice and adding a customer.
If it is still empty after restoring, it is a permissions matter: ask whoever manages the profiles in your company for access.
See also: Choose the period of the figures · Customise my home screen · Choose my workspace
More about Home
- How do I keep a record open next to the document?
- Choose the period of the figures
- Can I see the program in dark mode?
- The ERP home screen
- What is set up in Settings?
- What is ‘Setup’ and how do I read it?
- How do I read the help without leaving what I am doing?
- Notifications
- Customise my home screen
- What does each status colour mean?
- How do I get back to where I was?